Below are all of the draft maps submitted by June 27, 2023. Click on the link for a printable version of each proposed map, including a page providing the demographic summary of each district for each map.
The most detailed way to view each draft map is using the Interactive Review Map. The link takes you to a website where you can view all of the maps and zoom in and out to see the map details. A layer noting Census Blocks where Councilmembers live is now available in the interactive review map.
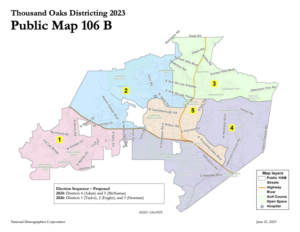
Selected Map
At the fourth districting public hearing held on July 11, 2023, the Thousand Oaks City Council reviewed the focus maps and all maps submitted by June 27, 2023. The City Council selected Map 106 B to consider for final adoption. To review the discussion, watch the meeting recording.
Focus Maps
At the third public hearing held on June 20, the Thousand Oaks City Council narrowed the pool of maps to the below focus maps and provided direction to National Demographics Corporation to create Map 106B and Map 111B for consideration at the fourth public hearing on July 11. To review how the focus maps were obtained, watch the meeting recording.


New Map Submissions
| Map | Original Submission | Date Published | Notes |
|---|---|---|---|
| Map 106B | June 22, 2023 |
Submitted by National Demographics Corporation based on direction from City Council during the third public hearing on June 20 |
|
| Map 111B | June 22, 2023 | Submitted by National Demographics Corporation based on direction from City Council during the third public hearing on June 20 | |
| Public Map 112 | June 20, 2023 | June 23, 2023 | |
| Public Map 113 | June 21, 2023 | June 23, 2023 | “Upon hearing council discussion about the maps selected for focus, I have revised Map 104 to have a lower deviation while still adhering to the Voting Rights Act and keeping communities of interests together. It assures that areas of lower income status are kept together (for example, low income neighborhoods along the 101 and in between Thousand Oaks Boulevard and Hillcrest drive are not combined with the wealthier Conejo Oaks neighborhood). The central district does not cross Tarantula Hill and stays as far to the east of Moorpark Road and Gainsborough Road as possible. It also runs cleanly along the 23 Freeway. As lower income neighborhoods are situated along freeway corridors it makes sense to use these freeways as fair boundaries. It also assures that the 101 Freeway is not crossed in Newbury Park and that Newbury Park south of the 101 is all in one district. Overall, the map has a deviation that is very balanced and nearly zero between districts.” |
| Public Map 114 | June 21, 2023 | June 23, 2023 | “This map is most similar to the Conejo Valley School District Map and will minimize voter confusion while fairly representing the common interests of each district.” |
| Public Map 115 | June 24, 2023 | June 27, 2023 | |
| Public Map 116 | June 27, 2023 | June 29, 2023 | “This map places the undeveloped Borchard property in Newbury Park, protects the community of interest made up of apartment dwellers, Latinos, and lower income residents, and preserves past voter preferences by providing each sitting councilmember with a newly drawn district.” |
Map Submissions
| Map | Original Submission | Date Published | Notes |
|---|---|---|---|
| Public Map 101 | May 4, 2023 | June 1, 2023 | |
| Public Map 102 | May 30, 2023 | June 1, 2023 | |
| Public Map 103 | May 15, 2023 | June 1, 2023 | From submitter: “Here is a short explanation of the thought process behind the map. District 1 is drawn to include much of Newbury Park, including Dos Vientos. It is bounded by the 101 and Ventu Park Road. District 2 was drawn to include the remaining sections of Newbury Park, in addition to Wildwood and the area by Los Robles. District 3 was drawn to include much of central TO, bounded by the 23, and Lynn, Olsen and Pederson Roads. However, a precinct was given to district 4 in order to keep CLU within the same district, while a neighborhood east of the 23 was added to district 3 to keep population even. District 4 includes CLU and Sunset Hills. District 5 includes Westlake and North Ranch.“ |
| Public Map 104 | June 6, 2023 | June 9, 2023 | |
| Public Map 105 | June 6, 2023 | June 9, 2023 | Non-contiguous at Lynn Rd & Ventu Park Rd |
| Public Map 106 | June 6, 2023 | June 9, 2023 | |
| Public Map 107 | June 6, 2023 | June 9, 2023 | Duplicate of Map 105 |
| Public Map 108 | June 7, 2023 | June 9, 2023 | Total population deviation exceeds 10% max |
| Public Map 109 | June 7, 2023 | June 9, 2023 | Non-contiguous at Lynn Rd & Ventu Park Rd |
| Public Map 110 | June 11, 2023 | June 12, 2023 | |
| Public Map 111 | June 12, 2023 | June 12, 2023 | From submitter: “We propose the following map which gives each current councilmember their own district, conforms to the allowable population per district, and keeps the Core Downtown Business District in one central district.” |
| NDC Orange Map | June 12, 2023 | ||
| NDC Yellow Map | June 12, 2023 | ||
| NDC Green Map | June 12, 2023 |
FAQs on Demographic Summary Reports
The Voting Age Population data in the PDF demographic report, which accompanies each draft map, was labeled as “Citizen Voting Age Population” (CVAP) data instead of “Voting Age Population” (VAP) data.
The term “Citizen Voting Age Population” refers to the population of US citizens aged 18 or older residing in a given area. “Voting Age Population” refers to the population of everyone 18 and older residing in an area, regardless of citizenship.
No. All of the data in the DRA public mapping tool, on the paper/PDF Public Participation Kit maps, in the interactive review map layers, and in National Demographic Corporation’s mapping tool were the correct data, correctly labeled.
The error only appeared in the labels in the PDF demographic reports, which were generated after maps were drawn and submitted for posting.
No. In Thousand Oaks, the Latino percentages of VAP and the Latino percentages of CVAP closely correlate. A neighborhood that has a relatively higher Latino percentage of VAP also will have a relatively higher Latino percentage of CVAP, so when reviewing how different maps impact different neighborhoods in Thousand Oaks, or when deciding whether or not to include a neighborhood in a given district, there is no practical difference between looking at VAP or CVAP data.
Not in Thousand Oaks.
In some jurisdictions, an important Federal Voting Rights Act consideration arises where it is possible to draw a district that is majority-Latino (or majority any protected class) by CVAP. However no such district is possible in Thousand Oaks.
Remember that race and ethnicity can be one factor in the selection of a map, but it cannot be what courts term “the predominant” factor in the selection of a map.
No. Both the VAP and the CVAP data were available and accurate in the DRA mapping tool. On June 23, 2023 the City provided a summary table with a side-by-side summary of the VAP and CVAP data for each district in each map.
Those reports are pre-programmed summary tables. The report can be configured to use VAP or CVAP data, but not both. Changing the report to show both would require reprogramming the report, which would take a few weeks and, in the interest of providing the public with complete access to the data as quickly as possible, NDC created a separate one-page summary of VAP and CVAP for all districts in all maps. NDC continues to update the table for each new map received.
As noted elsewhere, the VAP and CVAP data are closely correlated, and race or ethnicity cannot be the predominate factor in selecting a map, so providing both sets of data provides little added value for the map selection process.
No. Given the software limitations, NDC prepared a separate one-page summary of VAP and CVAP for all districts in all maps to make the data easier to review and compare. This information is on the website, and NDC continues to update the summary as additional maps are submitted.